
Energy prices
Ask Growi about electricity prices and you get a card with the Dutch day-ahead price per hour. The cheapest hours and negative prices are in Growi’s text, not on the card. Questions about your expected energy demand and the heating energy you used get a different answer.
How it works
Section titled “How it works”The price card
Section titled “The price card”Ask about electricity prices, energy costs, day-ahead prices or the cheapest hours to light or heat. No crop is needed. The prices are per hour, in cents per kWh, including VAT, in Dutch time. The start screen of the chat has a topic Energy with questions such as “What are today’s energy prices?” and “When are the cheapest hours to heat or light today?”.
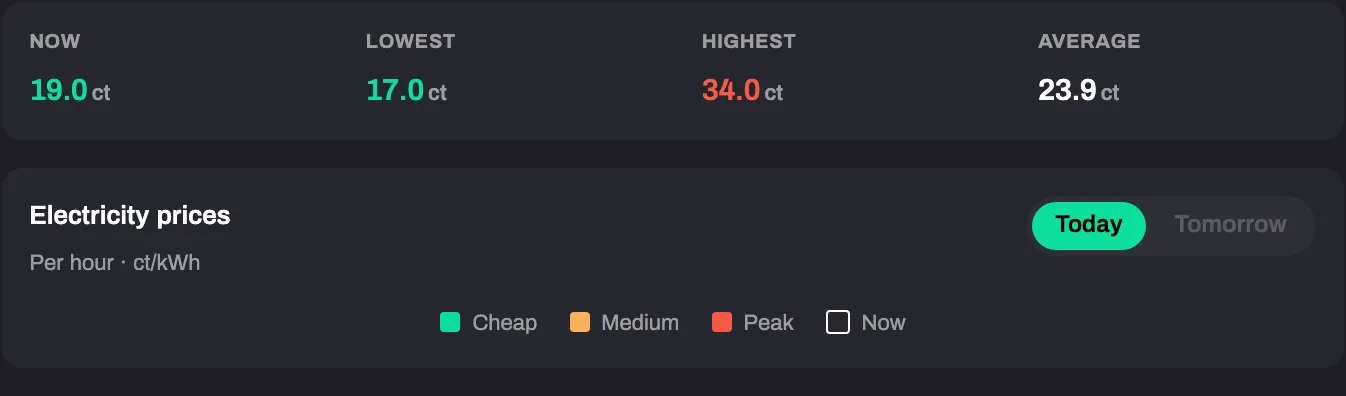
- Four figures at the top: Now, Lowest, Highest and Average, in ct. With Tomorrow selected, Now shows a dash.
- A bar chart Electricity prices with one bar per hour.
- Two buttons, Today and Tomorrow. Tomorrow is greyed out until tomorrow’s prices are available.
- A legend: Cheap, Average, Peak and Now. An hour under 7.5 ct/kWh is cheap. An hour at 85 % or more of the day’s highest price is peak.
In the text, Growi does not list every hour. It advises on the timing of lighting, dehumidification or heating. Ask for the cheapest hours and Growi can name the cheapest block of 2, 3 or 4 hours in a row. Growi can also tell you that some hours have a negative price. The card does not mark them.
Energy demand for the coming days
Section titled “Energy demand for the coming days”This needs one selected crop. Growi reads the energy forecast that is stored in LetsGrow, from the modules linked to your crop. It does not run an energy model of its own. You get one total per day in GJ, starting with today, or the hourly values when you ask for them. You get 7 days unless you ask for another period, and 14 days at most.
| Days with values | You get |
|---|---|
| 1 to 3 | The values in the text |
| 4 or more | A chart Energy demand forecast with the totals in GJ. Growi describes the trend and does not repeat the numbers |
The number of days that have values decides, not the number you asked for. Ask for a chart or a table and you get that shape whatever the number of days. Ask for a bar chart and the chart is drawn with bars.
Heating energy used
Section titled “Heating energy used”A question such as “how much heating energy did I use last week” needs a crop with its area filled in. It is answered only from measured consumption, never from a target or a forecast. The measured value is a figure for the whole greenhouse in GJ. Growi converts it to kWh/m² with the area of the crop and shows it as “Heating energy usage”.
If you name a target or setpoint, you get the target. A question about a future period is pointed to the energy demand forecast.
Limitations
Section titled “Limitations”- The prices are for the Netherlands only, for today and for tomorrow once those are out. There is no choice of country or price zone, and gas prices are not included.
- When the price service does not answer or has no prices for today, no card is shown. Try again a few minutes later.
- Without the energy forecast module on the crop, Growi tells you no energy demand forecast is available.
- Without a crop area or a measured value, Growi tells you that heating energy usage is not available for the crop.