
What's in a report
A report is a list of points of attention. Each point is one thing that deviated, with a severity (Critical, High or Medium) and one topic (Climate, Crop, Irrigation or IPM). The most severe points come first.
How it works
Section titled “How it works”Points of attention
Section titled “Points of attention”A report compares its period with the days or weeks before it, and a weekly report also with your targets. See Daily and weekly reports. What deviates becomes a point.
A point shows as “Topic - short description”, for example “Climate - VPD too low at night”, with one line on what happened. Under it, Show analysis opens the hypothesis of the cause and at most 5 observations from the data. A daily point also shows the hours of the day it applies to; a deviation that lasted the whole day covers the whole day. Where it helps, the analysis uses the knowledge base.
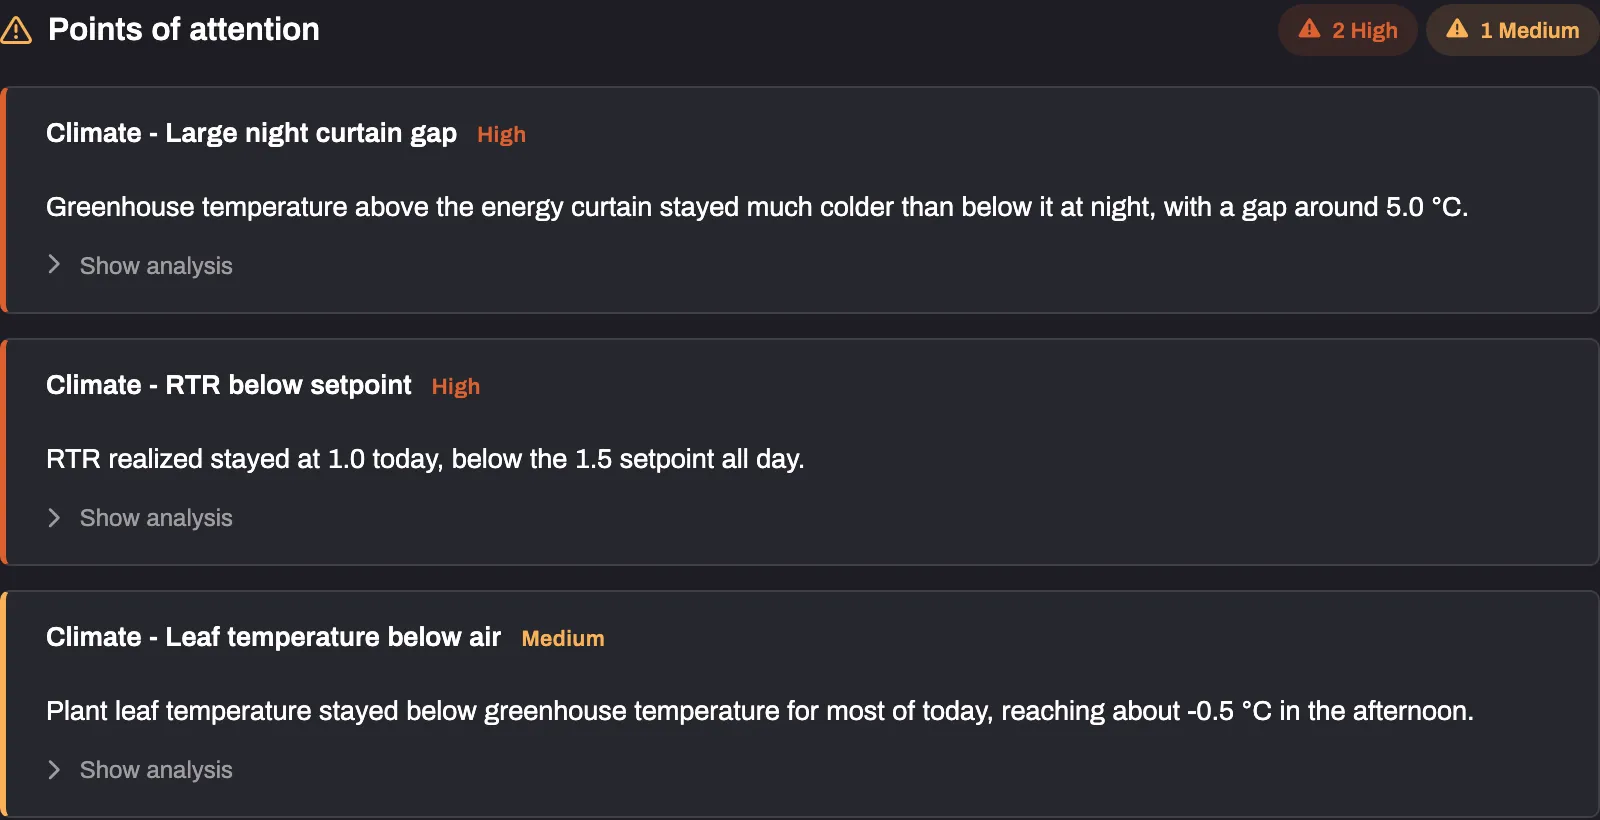
A report without points says “No points of attention.” That is a normal outcome. Every report ends with “This report is AI-generated. Apply professional judgment before acting.”
Severity
Section titled “Severity”| Severity | Meaning |
|---|---|
| Critical | A strong deviation that is a direct risk and is getting worse, or a sensor that lost its data or reads zero |
| High | A significant deviation that needs attention soon |
| Medium | A mild deviation, an early sign, or a deviation that is stable and not getting worse |
Topics
Section titled “Topics”Every point gets exactly one topic. You pick the topics on the schedule form, and a schedule needs at least one. In chat you name the topic, or leave it out to get all four. The form also shows Energy with “(soon)”. It cannot be selected.
The topics are Climate, Crop, Irrigation and IPM. On a point the topic comes first, followed by a short description, for example “Climate - VPD too low at night”.
Choosing topics filters the points, not the data. Every report reads the same modules of the crop, whichever topics you pick. IPM is the exception: its three modules are only read when you select IPM.
What a report reads
Section titled “What a report reads”| Report | Modules |
|---|---|
| Daily and weekly | Weather station, climate, climate extended, climate monitor, plant balance, plant PAR, light on plant, water |
| Weekly only | Target values, Strategy Manager target values, NovaCropControl, tomato crop quality, crop registration |
| With the IPM topic | IPM Scout, IPM Sticky Cards, GreenLinQ crop protection |
A daily report counts the hours per day outside your climate monitor limits for greenhouse temperature, relative humidity and CO₂. It needs a climate monitor module for that. A period outside the limits counts from 30 minutes.
A weekly report compares realised values with your targets per week: average target, average realised, deviation. Only items with both a target and a realised value are compared. For climate these are greenhouse temperature (day, night, 24-hour), CO₂, RH, humidity deficit, RTR, radiation sum and PAR. For irrigation only substrate EC and dry-back. With a NovaCropControl module, a weekly report also sets young leaf next to old leaf values, and irrigation water next to drain water values.
Limitations
Section titled “Limitations”- Something that was the same all through the comparison period is not a point. A compartment that is always warm does not show up until it changes.
- A value that is normal for the stage of the crop is not a point. In the weeks after planting of tomato, cucumber, eggplant or pepper, no drain is expected until the substrate is saturated, so a report does not flag zero drain then. It judges the stage from the cycle start of the crop; without a cycle start it treats the crop as established.
- Without target values, a weekly report still compares with the previous weeks, but has no targets to compare with.
- A report knows your cultivation plan only from your custom instructions, the crop memory and the additional context of the schedule. See Custom instructions and crop memory.